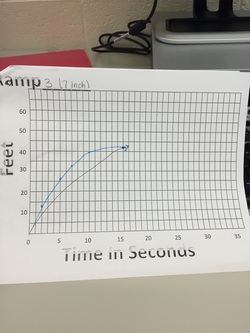
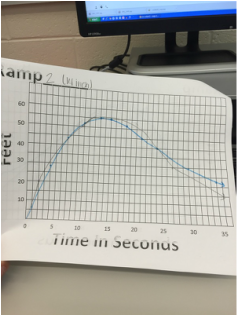
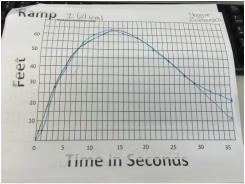
My predictions of the graphs were almost the same as the actual graph. The part that my graph was usually off at was the end because the skate board started to slow down after a while and the slop stopped going down at the same rate. The Zero's were when the Skate board was on the back of the ramp. The Zero's are all the same because they all started at the back of the ramp. When the graph is rising its fastest is right after it leaves the ramp and is rolling up the driveway. It slows down right about at the maximum of the graph. It then picks the speed back up and goes down the driveway and slowly comes to a halt.
 RSS Feed
